Introduction
BasicMicro Motion Studio provides the ability to graph different motor, encoder and controller values against each other in real time. This functionality is available in the PWM Settings, Velocity Settings and Position Settings windows.
What is Graphing Used For?
The graphing feature of Motion Studio can be used for a variety of tasks. When manually tuning PID values for velocity or position control the actual value of velocity or position can be graphed against the setpoint to check for over/undershoot and oscillation to help refine the PID values. Battery voltages can be monitored while running one or both motors to check for voltage sag or regenerative voltage spikes. The temperature of he motor controller can be monitored to ensure that operating motors at high power settings does not over heat the controller or that additional cooling hardware is working properly. Also the operation of encoders can be monitored under a variety of test conditions.
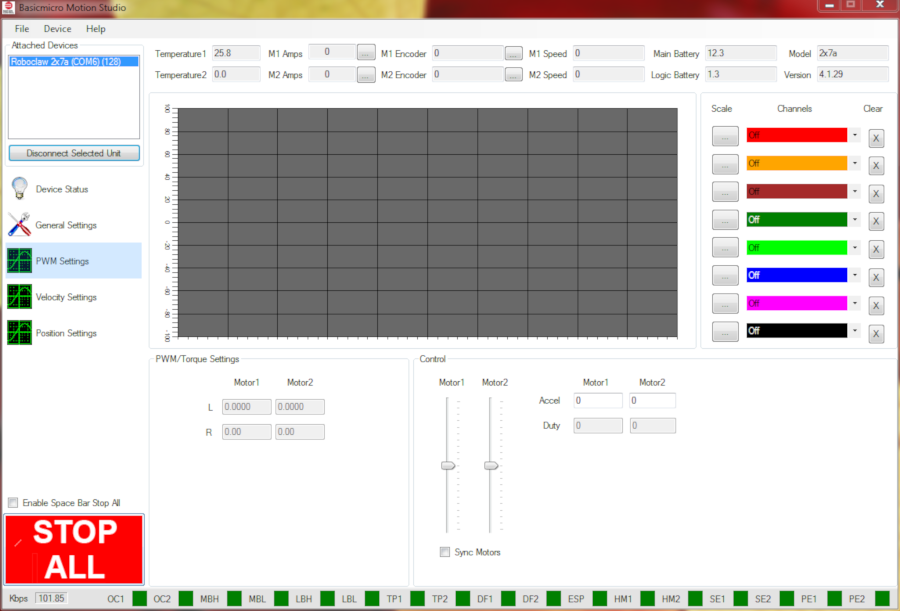
Figure 1
Graphing inside the PWM Settings window.
The Graphing Interface
The graphing interface only contains a handful of features. These are listed and explained below.
Channels
Motion Studio’s graphs can display a maximum of 8 channels of data at a time. Each channel is plotted in a different color for readability.
Parameters
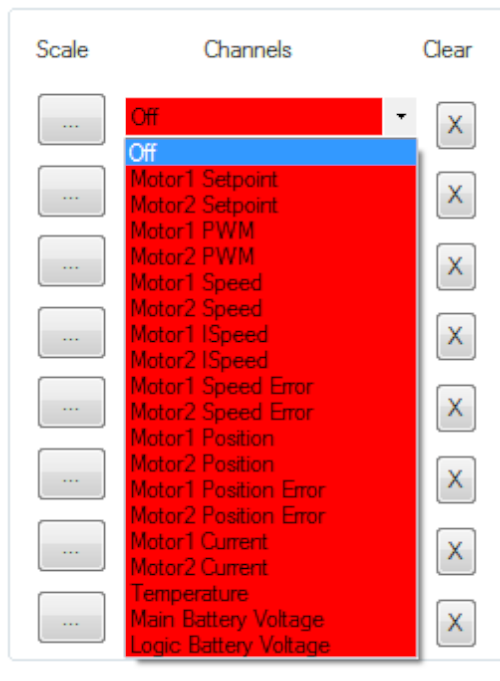
Figure 2
The parameters available to graph for each channel.
Motor 1 Setpoint
This displays the current setpoint of motor channel 1 for the sliders used in the PWM Settings, Position Setting and Velocity Settings windows.
Motor 2 Setpoint
This displays the current setpoint of motor channel 2 for the sliders used in the PWM Settings, Position Setting and Velocity Settings windows.
Motor 1 PWM
This displays the pulse width modulated output being output by the motor controller for motor channel 1.
Motor 2 PWM
This displays the pulse width modulated output being output by the motor controller for motor channel 2.
Motor 1 Speed
This displays the encoder count of motor channel 1 in quadrate pulses per second
Motor 2 Speed
This displays the encoder count of motor channel 1 in quadrate pulses per second
Motor 1 Ispeed
This displays the instantaneous speed of the motor attached to motor channel 1. This is the raw value of speed as read by the controller.
Motor 2 Ispeed
This displays the instantaneous speed of the motor attached to motor channel 2. This is the raw value of speed as read by the controller.
Motor 1 Speed Error
This displays the difference between the actual motor speed and the setpoint in quadrature pulses per second for motor channel 1.
Motor 2 Speed Error
This displays the difference between the actual motor speed and the setpoint in quadrature pulses per second for motor channel 2.
Motor 1 Position
This displays the position of the motor attached to channel 1 in encoder counts.
Motor 2 Position
This displays the position of the motor attached to channel 2 in encoder counts.
Motor 1 Position Error
This displays the difference between the actual motor position and the setpoint in encoder counts for the motor attached to channel 1.
Motor 2 Position Error
This displays the difference between the actual motor position and the setpoint in encoder counts for the motor attached to channel 2.
Motor 1 Current
This displays the current reading of motor channel 1
Motor 2 Current
This displays the current reading of motor channel 2
Temperature
This displays the temperature of the motor controller
Main Battery Voltage
This displays the voltage of the main battery.
Logic Battery Voltage
This displays the voltage of the logic battery, if used.
Scale Button
This button scales the graph to accommodate the range of the channel it is applied to.
Clear Button
When clicked this button clears the graphed data from the channel it is applied to.
Using the Graphing Interface
The graphing functionality is straightforward and easy to use. Begin by selecting one of the eight channels to use and select a value to graph from the dropdown. From here another channel and value can be selected to graph at the same time. Once the values to graph have been selected the graph will automatically update and begin plotting the values. The scale button can be used to scale the graphing to be plottable. If a channel’s plot needs to be cleared the clear button can be clicked to clear the data. Once the graphing has started the controls in the PWM Settings, Velocity Settings and Position Settings windows can be used to operate the motors and their operating values observed in the graphing window.
Figure 3
A demonstration of using the graphing in Motion Studio.